
Institutional clarity through underwriting
How a Washington, DC developer delivered the institutional transparency that supported a successful capital raise.
Representative case study. Figures and terms are illustrative; not investment advice or an offer.

A complex development, told simply
NextGen Development set out to underwrite Eckington Mews with the discipline, transparency, and analytical rigor expected by sophisticated investors. Rather than a conventional, project-specific model, the firm invested in a unified financial platform — one that could communicate the investment, support the capital raise, and guide the project as it evolved.
That platform had to absorb phased capital contributions, evolving ownership, land capitalization, recapitalizations, and negotiated partnership economics — without rebuilding the underlying architecture. Every dollar of contributed equity needed to stay fully traceable, from its budgeted use through final distribution, while the model responded instantly to changing assumptions and held complete reconciliation.
And it had to be one governing record: a single source of truth for underwriting, investor reporting, partnership economics, and capital formation across the life of the project.
Native Excel formulas — no macros, no refresh step.
Every equity dollar visible, from use account to distribution.
Reconciles automatically as ownership and assumptions change.
The cash flow is both calculation engine and presentation layer.
What he created for us went well beyond our expectations.
One reconciled source of truth
InstitutionalModels™ built a unified financial platform around a single governing principle: every financial outcome should derive from one reconciled source of truth. Rather than solving each phase independently, the platform applies a consistent framework for allocating, validating, and aggregating capital across the entire project — so ownership structures, financing, and partnership economics can evolve without rebuilding the underlying architecture.
Capital is first classified by its intended use, then allocated to the appropriate development phase, reconciled within that phase's ownership structure, and consolidated into the aggregate partnership. Because every transaction follows the same framework, changes to ownership, financing, recapitalizations, or additional phases are absorbed without new calculation logic or broken relationships.
The monthly cash flow became the governing financial record. Every schedule, capital account, distribution, investor exhibit, and reporting view is generated directly from the same underlying transactions — so sponsors, investors, and advisors always work from a single reconciled platform.
Every dollar of contributed equity is accounted for, providing complete transparency across every phase of the investment.
Selected detail on client solutions
Every model is unique to the project it underwrites. The five sections that follow examine selected aspects of Eckington Mews — and how the model delivered on the client solutions the engagement required.
- 01Project Schedule03.1
Every use tied to a phase, funding source, and S-curve — monthly costs, draws, and equity calls generated automatically.
- 02
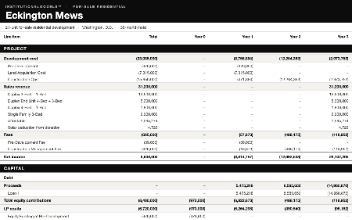 Consolidated Cash Flow03.2
The governing record — every transaction, rolled up from monthly periods into four reconciled modules.
- 03
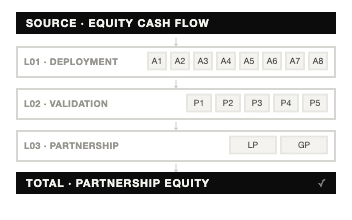 Three-Layer Equity Architecture03.3
Capital classified once at deployment, validated by phase, aggregated to the partnership.
- 04
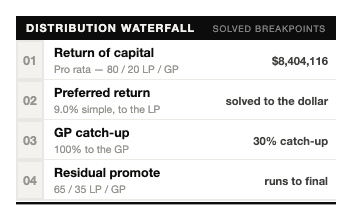 Formula-Driven Waterfall03.4
Every promote tier solved to a fixed dollar breakpoint — no circularity, no macros.
- 05
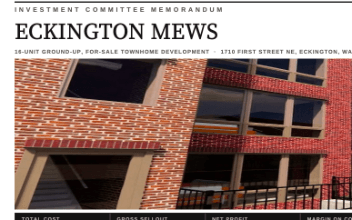 The Offering Memorandum03.5
The capital-raise document, generated directly from the model — no translation layer.
What was built
Five elements of the platform, in detail. Each is generated from the same monthly cash flow — move an assumption and every figure below re-derives.
Project Schedule
Every development use is linked to a phase, schedule, funding source, and partnership structure. Construction costs follow configurable S-curves — automatically generating monthly expenditures, debt draws, and equity requirements. The schedule is itself an output: move a phase, and the Gantt, the draw curve, and every downstream figure re-illustrate from the same record.
Consolidated Cash Flow
The cash flow is the model's centralized calculation sheet, organized into four self-contained modules — Project, Capital, Performance, and Tracking. Each operates independently from a common transaction layer: a modular architecture that improves auditability, validates by design, and adapts as the project or capital stack evolves.
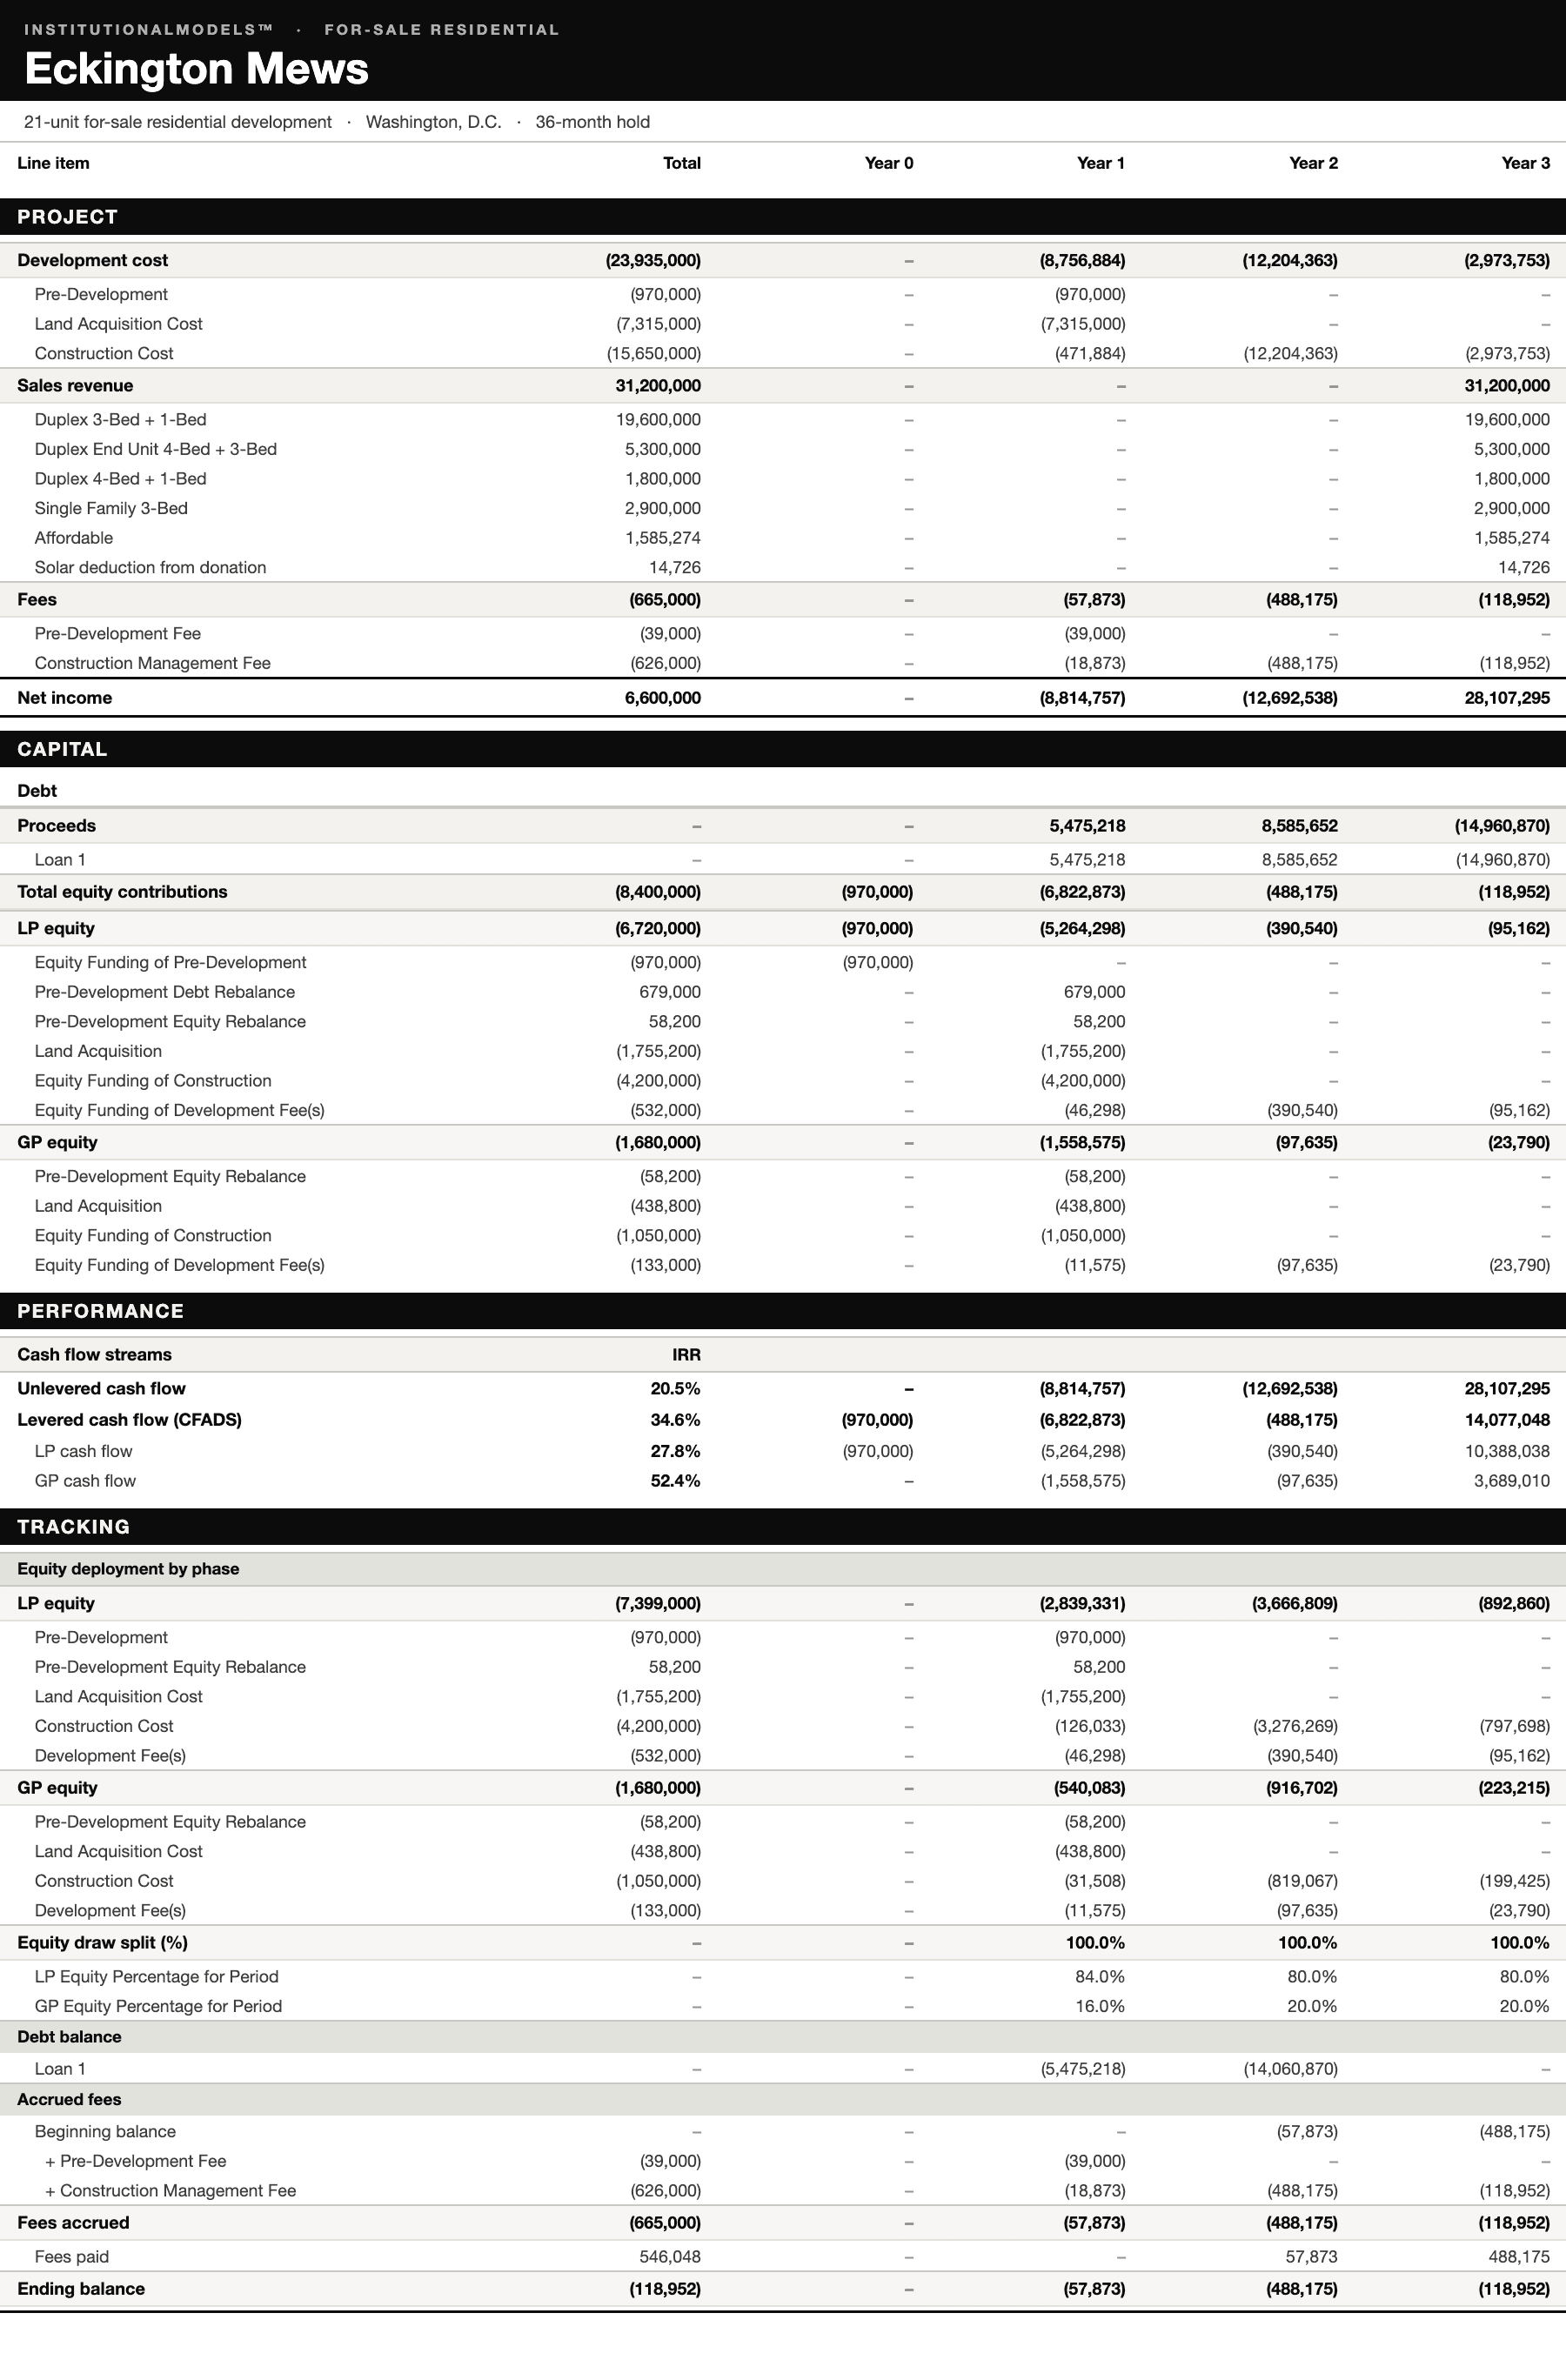
Uses and sources of the deal — development budget, sales revenue by unit type, and the fee stack. Net income is the unlevered result.
How the project is funded — debt draws and repayment, then every equity dollar classified by use, split LP / GP, and rebalanced as financing arrives.
The four return streams, from unlevered project cash through the LP / GP split.
Supporting schedules from the same record — equity deployed by phase, the draw split, the loan balance, and accrued fees.
Three-Layer Equity Architecture
The architecture applies institutional fund-aggregation principles to phased development. Capital is classified once at deployment — new phases, revised ownership, recapitalizations, and changing funding requirements are absorbed by the existing framework, while every downstream equity schedule is generated automatically from the same transactions. Each phase reconciles independently before aggregating into the joint venture, preserving complete traceability from every partnership balance back to the original cash movement.
Formula-Driven Waterfall
Every promote tier reconciles precisely, so distributions validate and the economic impact of any assumption change is visible in real time. The preferred return is calculated from the timing and amount of each equity contribution; the model then advances through GP catch-up, residual promote, and any further tiers per the partnership agreement. Because every breakpoint resolves to a fixed value, the entire waterfall stays auditable on the face of the model.
Breakpoints solve to exact dollar amounts directly from the cash flow. No circularity, no iteration, no macros — every tier auditable on the sheet.
Technically possible in formulas, but neither straightforward nor as easily auditable — an IRR breakpoint depends on when capital returns, not just how much.
The Offering Memorandum
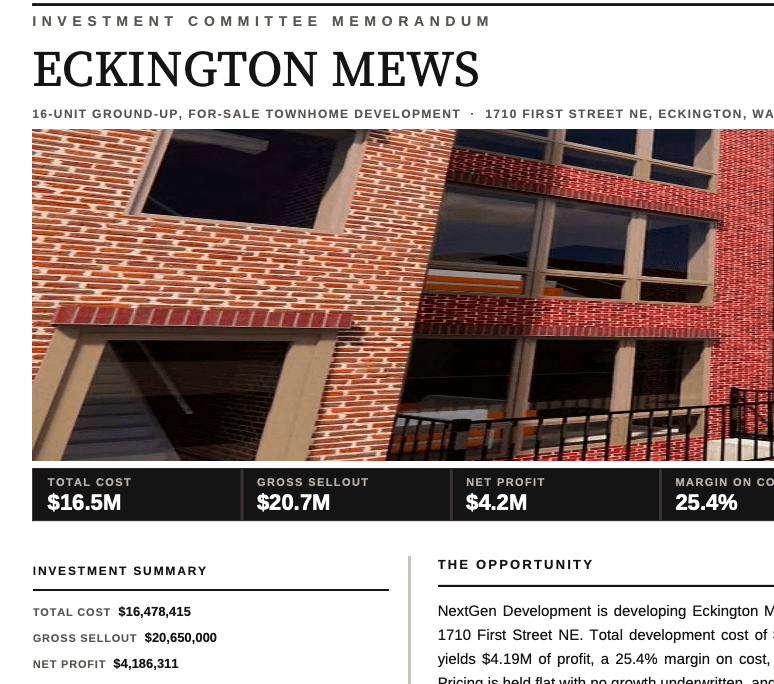
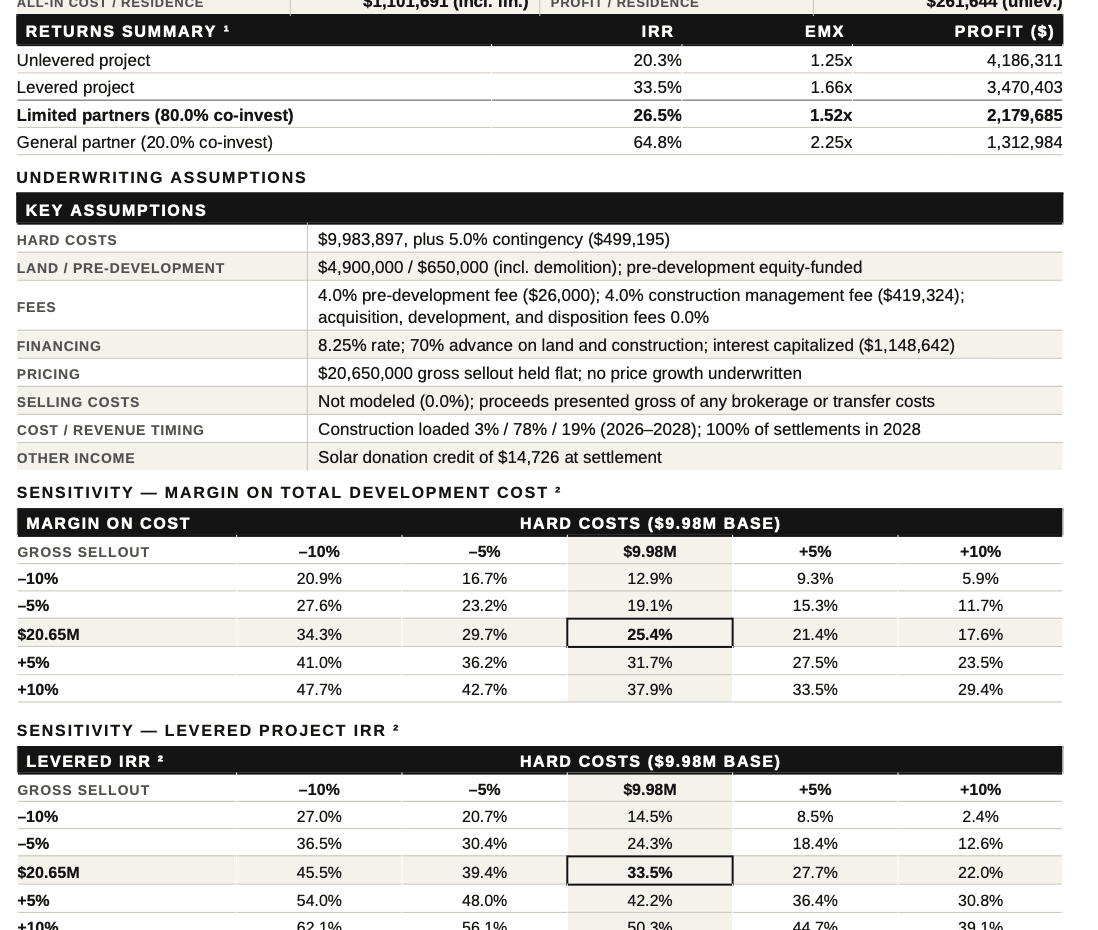
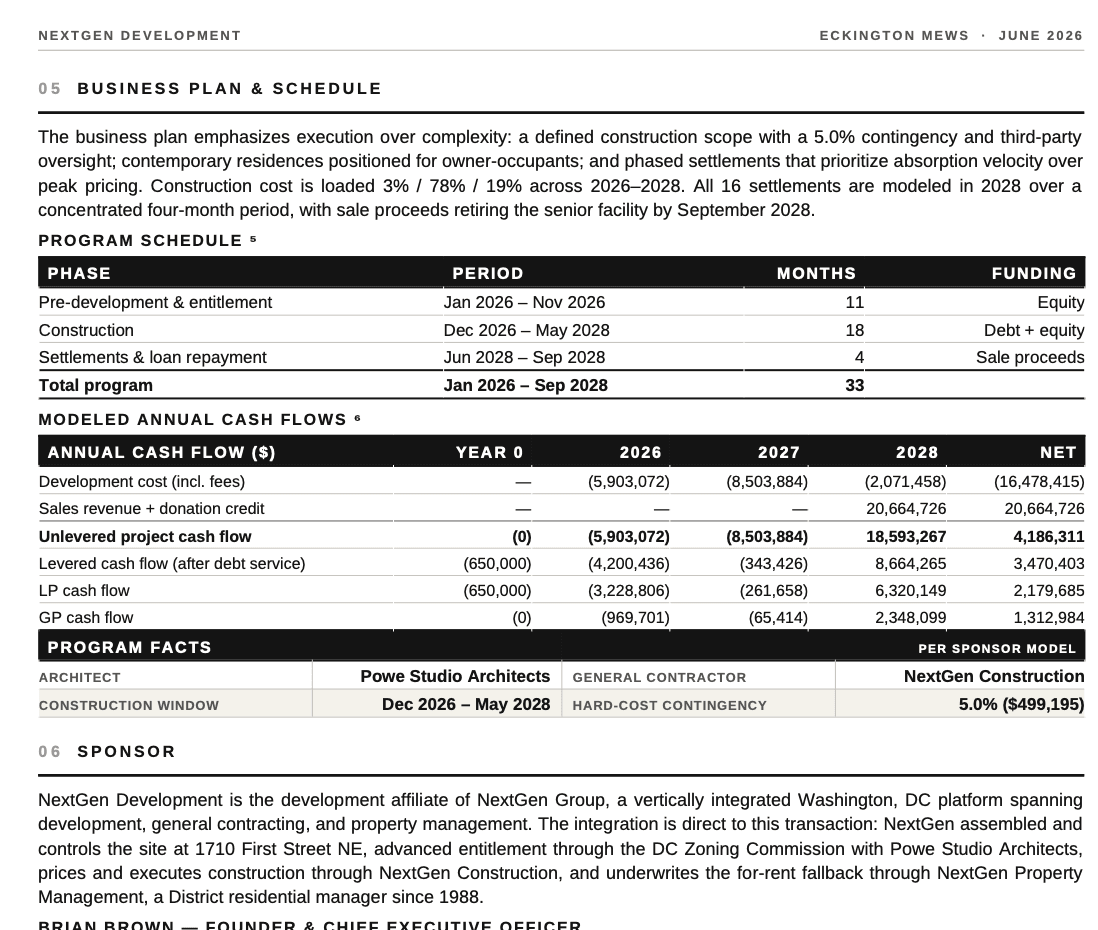
The platform's principal output was a confidential Offering Memorandum prepared for the client's accredited-investor network. Every exhibit, schedule, and metric was generated directly from the model — combining the accessibility of a traditional memorandum with the rigor of an institutional investment-committee package. As the transaction evolved, the memorandum evolved with it.
A successful raise, and a reusable standard
The platform became the foundation for the project's Offering Memorandum and capital raise — keeping underwriting, investor materials, and partnership economics fully synchronized within a single model as the transaction evolved and terms were finalized.
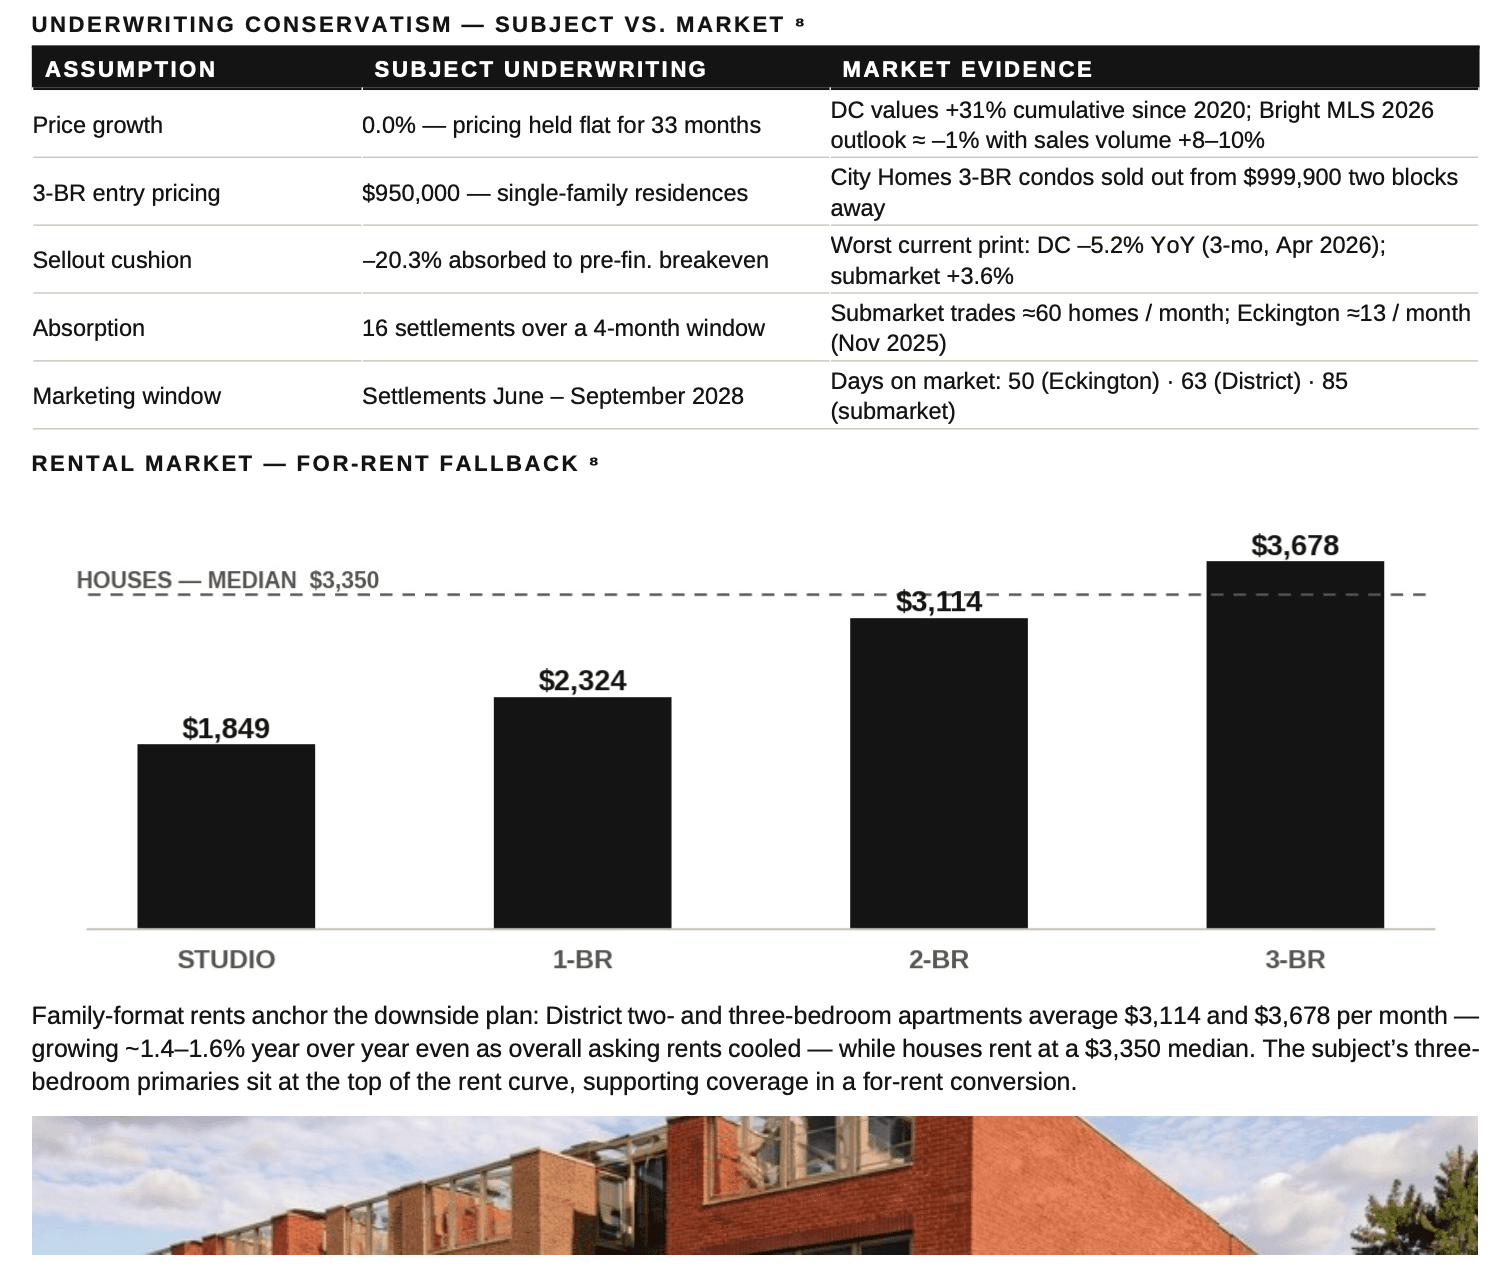
Risk was presented with the same discipline. Downside reference points quantified how far the deal could absorb stress — sellout falling 16.5%, or hard costs rising 28.9%, before levered breakeven — so investors underwrote the downside alongside the base case. The analysis is generated, not assembled: each table re-derives from the model whenever an assumption moves.
The result extended beyond a successful raise. NextGen Development established a repeatable institutional financial framework — capable of supporting future developments while presenting investors the transparency, rigor, and governance expected of institutional sponsors.
Ranges 3.1%–63.6% across ±10% gross sellout and ±10% hard costs. Full grid on desktop.
Returns & sensitivity — the underwriting
Exhibit · From the Offering MemorandumProject-level, pre-tax. LP and GP reflect the 80 / 20 co-investment and the negotiated waterfall — 9.0% preferred, 30% catch-up, 65 / 35 residual. Figures per sponsor model v10; certain amounts adjusted for confidentiality — see disclosures.
“What he created for us went well beyond our expectations.”
“Alex and his consultancy InstitutionalModels were referred to me by a prior client, and he built the underwriting model behind Eckington Mews — our ground-up for-sale townhome development in Washington, DC. We expected a competent professional. What distinguished Alex was not his background, but the quality of his work product.
The model solved our biggest challenge: clearly communicating the economics of a complex development across multiple phases of investment, financing, construction, and sales. What could have been a complicated story became intuitive and transparent. For our investors, this transformed our greatest communication challenge into one of the project’s greatest strengths.”
Insights and solutions, delivered.
The form sends you a PDF version of this case study with additional model exhibits — waterfall detail, reconciliation views, and cash-flow specimens not included on this page.
If you elect, you’ll also receive periodic case studies such as this one in your inbox as they’re released.
No marketing lists. We do not sell or share contact information. See our privacy policy.